
The deployment of smart grid communication devices such as radio modules, sensors, routers and gateways that communicate through various communication channels and protocols over the Internet of Things IoT is rapidly increasing in decentralized energy management systems. The main goals of this work within the PETER project were to design of EMI sources and to set up a measurement procedure for the propagation of the EMI signal to different smart grid subsystems.
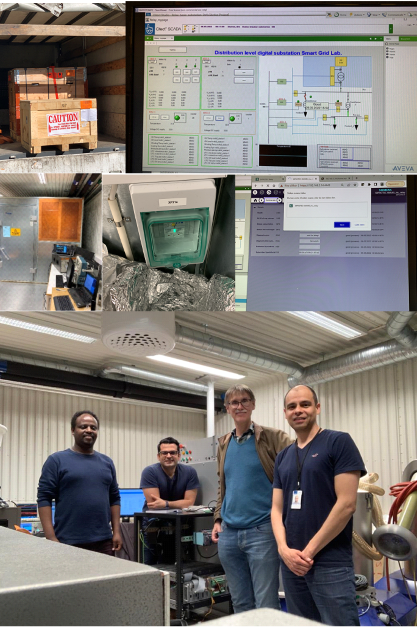
Due to the requirements for assessing the vulnerability of a complex smart grid system to Electromagnetic Interference (EMI) as a part of the PETER project objectives, access to one of the European smart grid laboratories was required, which had to be done by providing an access proposal for the laboratory via the EriGrid2 project. The required proposal was submitted to EriGrid2 project coordinator by ESRs 1, 2 and 15 as members of PETER project, and was accepted by the EriGrid2 project correspondent.
Of the seven labs listed by the Erigrid2 project; options were narrowed down to three by evaluating them against the following criteria: measurement equipment, simulation opportunities, innovation, language barrier, and networking opportunity. From the three remaining options, SINTEF Energy Research, Norway received the highest score. Further proposal was submitted to the EriGrid2 project manager at the desired site to describe the reasons for accessing the laboratory and exploring the measurement facilities in their institute.
Each of the ESRs had their reasons for participating in the EriGrid2 lab access. ESR1, based at Leibniz University Hannover Germany, was interested in the theoretical aspect, and here no physical presence on site was required. However, the intent of ESR2, based at the Bundeswehr Research Institute for Protection Technologies and CBRN Chemical, Bio, Radiation and Nuclear Protection, Germany (WIS), was to have a physical presence, apply the electromagnetic disturbance (EMD) signal to subsystems of the smart grid system, and to evaluate suitability of the overall system. In addition, ESR15 from the Fraunhofer Institute for Technological Trend Analysis INT Germany, planned to be physically present, access the simulated smart grid system, and to assess the system’s susceptibility to simulated EMD.
Due to a lack of some of the required equipment at SINTEF, such as Arbitrary Waveform Generator, RF Amplifier and RF Antennas, WIS shipped the necessary equipment to Trondheim, Norway to be used by ESR2. Because of the customs restrictions imposed by the Norwegian border authority, the shipment had to be planned and scheduled a month in advance by WIS in order to be on site on time.
Introduction to work carried out by ESR2
Devices with different functions are available at the SINTEF Energy Research smart grid laboratory, e.g. Intelligent Electronic Devices (IEDs), Real Time Units (RTUs) and Measurement Units (MUs), which are crucial for sophisticated smart grid systems. The complex overall system structure used for this work is shown in Figure 1. As shown in Figure 1, smart grid system is a combination of four categories of physical hardware (IEDs, RTUs, MUs, and PMUs), real-time simulator (OPAL-RT), communication layers including protocols (IEC 104 and IEC 61850), and software components (HMI and SCADA systems). These four elements work together to provide visibility and operability for the SCADA (Supervisory Control and Data Acquisition) engineer.
Figure 1. Smart-Grid complex communication system
Methodology and measurement setup
The steps to plan the measurement process were to take a device as a sub-system from the connected complex smart grid system, and physically position this device in a Faraday cage in one of SINTEF’s energy laboratories in collaboration with the Norwegian University of Science and Technology (NTNU). The devices were positioned in the test environment by running two fibre optic cables from the smart grid lab to the Faraday cage without affecting the actual structure of the communication network. Sweep period jamming (SPJ) signals with three different frequency ranges (100-200 MHz, 500 MHz-1 GHz and 1-3 GHz) were then radiated into the device under test (DUT). Next, the data transmission rate of the associated communication protocol, and the functionality of the DUT, as well as, the causes of the radiated EMI signal to other devices were monitored. One example of measurement setup is given in Figure 2.
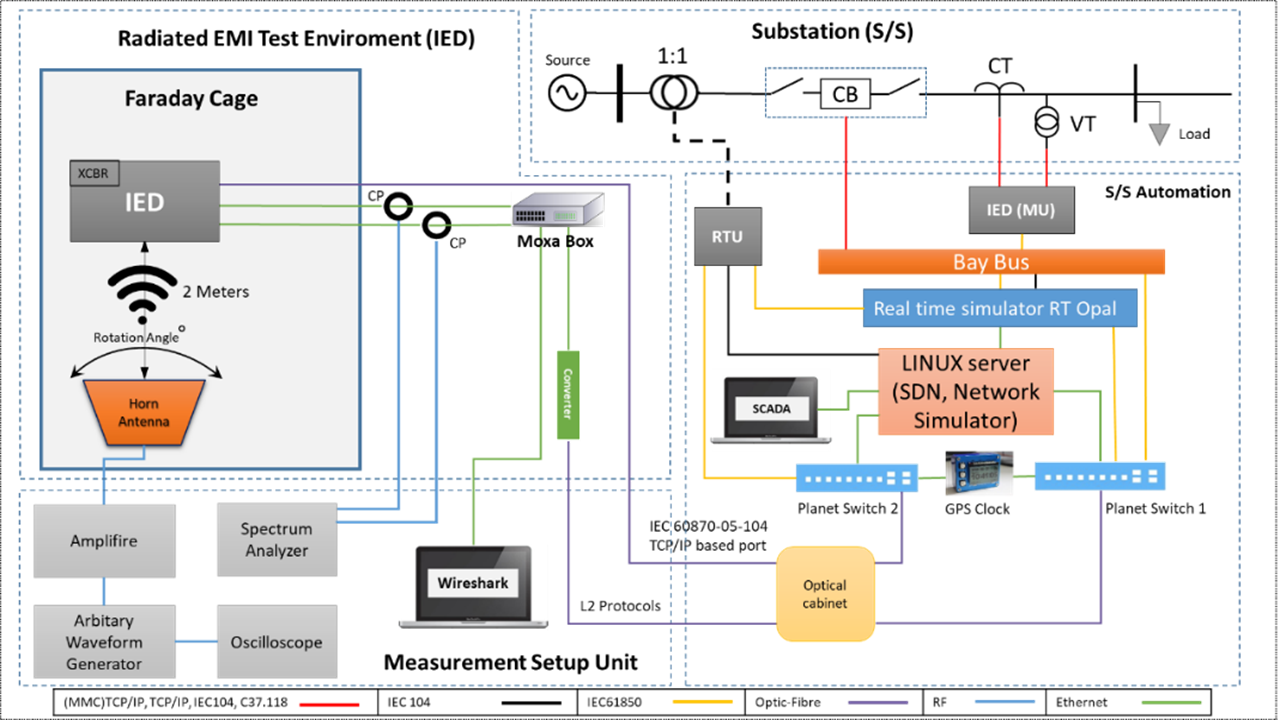
Figure 2. IED positioned in Faraday-Cage under EMI test
Measurement results
The susceptibility of the complex smart grid system considering the subsystems and the associated communication channels to radiated SPJ signals was assessed, and the results of the measurements of one of the setups are given in the following sections. In order to cover the frequency range of data communication between subsystems and internal components of the DUTs, a wide range of the radiated SPJ signal was considered to be radiated, including 100 to 200 MHz, 500 MHz to 1 GHz and 1 to 3 GHz. The measurements are repeated 30 times for 20 seconds of duration for each criterion.
Radiated SPJ into IED
For SPJ signal radiated into the IED positioned in the Faraday-Cage, the data-packet transmission-rate of IEC 60870-5-104 was monitored using Wireshark software considering different frequency intervals and power gain of EMD. Table. I illustrates the variables considered for this experiment.
Table I. Frequency and power gain variables used for radiated EMD into IED
| Frequency | Power gain |
|---|---|
| 100 to 200 MHz | 0% of 250 W |
| 35% of 250 W | |
| 500 MHz to 1 GHz | 0% of 250 W |
| 35% of 250 W | |
| 55% of 250 W | |
| 1 to 3 GHz | 0% of 20 W |
| 35% of 20 W | |
| 55% of 20 W | |
| 75% of 20 W | |
| 100% of 20 W |
SPJ signal with frequency range of 500 MHz – 1 GHz
This section provides an example of analysing the effect of an EMD SPJ signal with a frequency range of 500MHz – 1GHz radiated to the IED placed in the Faraday cage. As can be seen in Figure 3, the mean data packet transmission rate of the associated communication channel shifts to 3.8 packets/s when the power gain is 35 percent of 250 W, compared to 0 percent and 55 percent power gains with mean values of 0.51 and 0.59 packets/s. After increasing power gain to 75 percent, the mean shifts to 4.1 packets/s, and the standard deviation (STD) of the normal probability distribution has increased to 4.68, compared to 1.3 at 0 and 55 percent power gains.
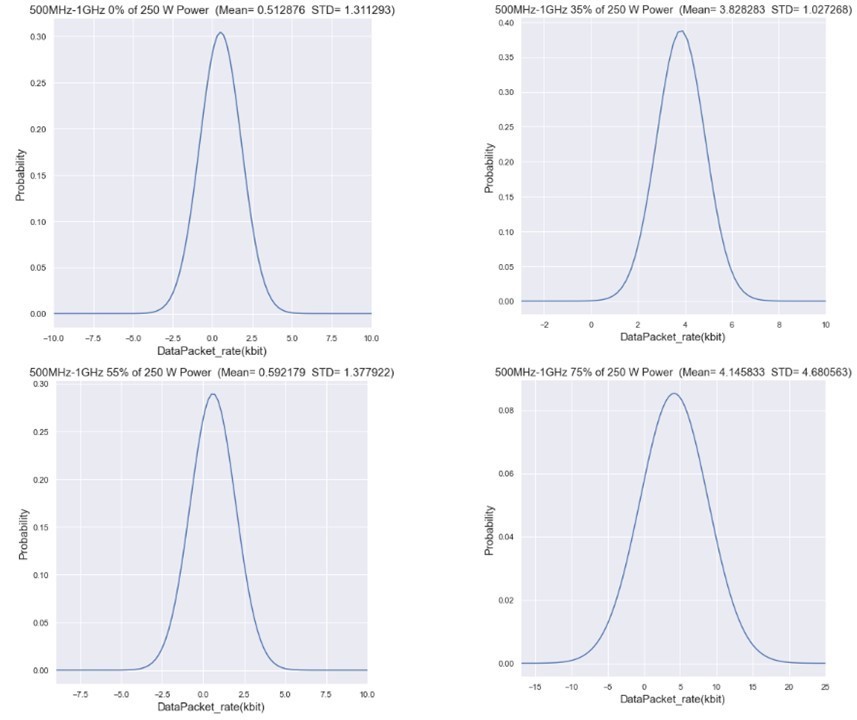
Figure 3. SPJ signal with frequency range of 500 MHz – 1 GHz radiated into IED
Increasing the power gain of the radiated SPJ signal has caused the reduction in the probability of data packet transmission of the IEC 60870-5-104 protocol down to around 0.09 packets/s when a power gain of 75 percent is applied. Upon visual inspection, the transformer circuit breaker, shown in Figure 4 below, opens and closes during EMD emissions in the 500MHz to 1GHz frequency range.
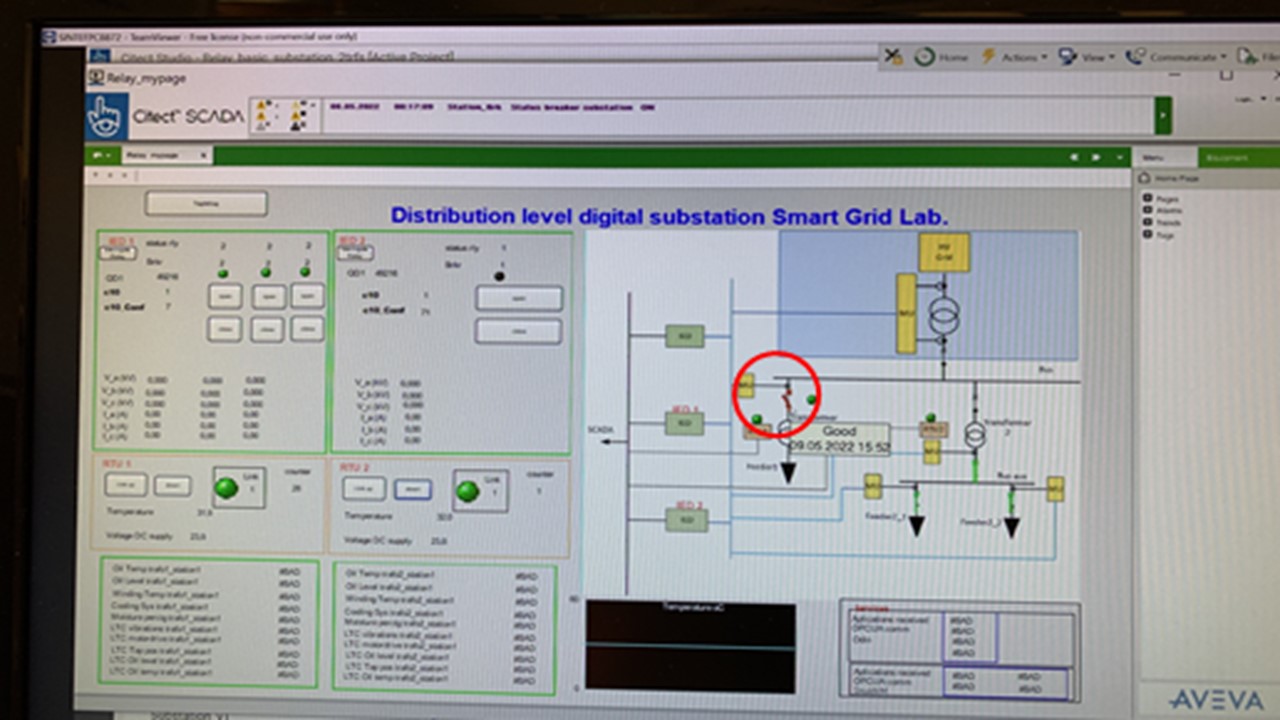
Figure 4. Transformer circuit breaker opens and closes during SPJ radiation
Summary
In summary, the deployment of smart grid communication devices such as radio modules, sensors, routers and gateways that communicate through various communication channels and protocols over the Internet of Things (IoT) is rapidly increasing in decentralized energy management systems.
The main goals of this work within the PETER project were to design of EMI sources, and to set up a measurement procedure for the propagation of the EMI signal to different smart grid subsystems. Then, to monitor the impact of the coupled EMI signal on the subsystems as well as the overall system, and statistically test the susceptibility of the complex smart grid system to low-power EMI disturbance signals. The measurement results can be used for the proposed statistical risk assessment approach, using standards as a basis for the risk-based approach of EMI risk analysis.
About the Author: Arash Nateghi
 Arash Nateghi graduated in electrical and power engineering MEng from University of Bath, UK on 2016. He has previously worked for the UK electrisity transmission system operator (SO), National Grid, as a SCADA and data intefrerences engineer from 2014 to 2015. He also worked for National Grid electricity transmission owner (ET) as a system desgin enineerer from 2016 to 2018. Then he joined Burns & McDonell T&D as a power system consultant working mainly on smart energy solotions from 2018 to 2019.
![]()