
FRAM (Functional Resonance Analysis Method) is a graphical tool for demonstrating how a process is done through multiple functions and activities.
FRAM (Functional Resonance Analysis Method)[1] is a graphical tool for demonstrating how a process is done through multiple functions and activities. Although it initially developed as a systemic accident analysis method, it can be used for analysing any process (design steps, task management, etc.). FRAM has been established based on the principle of ‘The equivalence of Successes and Failures’ in the way that they happen for the same reason. Therefore, to find out how something goes wrong, we need to understand how things work correctly. Moreover, the relationships between activities are not limited to a causal link, and different aspects of an activity should be considered to reach a thorough comprehension of a process.
Applying FRAM comprises four steps:
- Identifying and describing essential functions to have a successful process
- Finding out if there is the variability of the functions (if the process can be done in another way)
- Determining how the variability of a function impact the process
- Introducing recommendation for managing the undesired outcomes
Each function can be described by its six aspects:
- Input: Items that are processed in the function
- Output: the result of the function
- Precondition: conditions that must exist before function starts to work
- Resources: items that are consumed during the process
- Time: temporal constrain on the function
- Control: the ways that a function is monitored
Figure 1 depicts how a function and its aspects are shown in FRAM.
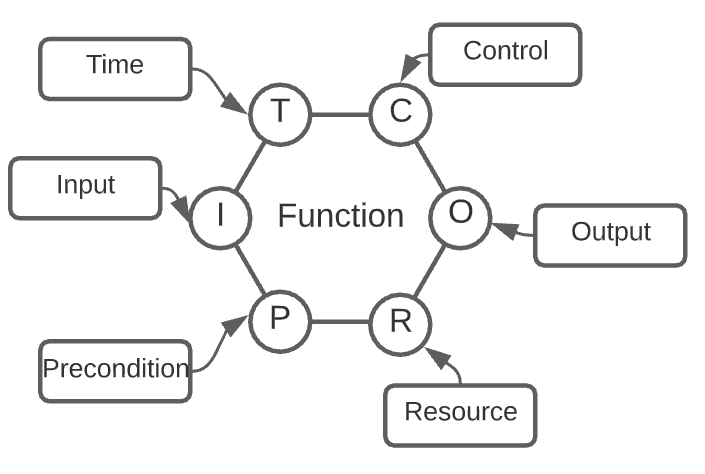
Figure 1: A function and its aspects
After determining all functions and their aspects, functions can be coupled to together through their aspects. In FRAM, this is illustrated with a line between aspects.
How to make a cup of milk tea: a delicious example
Making a cup of milk tea, like any other processes, can be demonstrated by FRAM. The instruction for making Milk Tea can be described as below:
- add water into a kettle
- Boil the water
- Put a teabag in a cup
- Pour the boiled water in the cup
- Wait 3 minutes for the tea to brew
- Remove the teabag
- Pour in a dash of milk
- Stir with a spoon
- Drink and enjoy
Each these functions may have multiple aspects that considering them is essential in order to have a successful process. The FRAM diagram of this process is illustrated in figure 2.
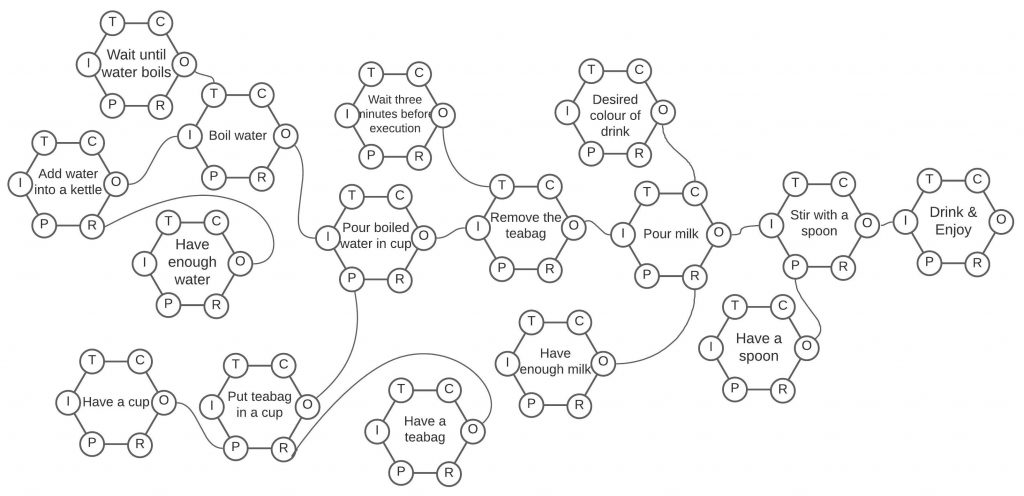
Figure 2: FRAM diagram of making tea
There are multiple alternative ways of demonstrating this process. In a complete FRAM analysis, it is essential to identify those ways and investigate their effects on the process and the outcome. A full description of the method, philosophy and the free version of FRAM model visualiser application are available on the developers’ website (find the link in the reference).
Reference
[1] https://functionalresonance.com
About the Author: Mohammad Tishehzan
 Mohammad obtained his master’s degree in electrical engineering (field and wave) from the Amirkabir University of Technology in Iran (2019). For his master’s project, he focused on analyzing and developing radar-based microwave imaging for medical purposes. Besides, he has several years of experience in EMC and RF compliance testing industry.
![]()